Part 1 in this series examined the 2009 Readership Segmentation Survey demographics and this installment will continue by examining and comparing respondent’s media and culture habits along with blogging and online habits. Undoubtedly, these sections produced some of the most fascinating and constructive data from the entire survey and will serve as some of the most useful information for other cultural bloggers and arts managers…
 In particular, the data serves as the first step for performing arts organizations to begin understanding and articulating the benefits of becoming involved in the field of culture blogging. In general, blogs of all variety have created deep-seated and unique relationships with a wide variety of readers and there is no reason to believe this same potential doesn’t exist for performing arts organizations. For more information on how to begin building healthy relationships with new media outlets, visit the series of articles I published in 2008 on how to connect with new media or download the free eBook here.
SECTION #2: MEDIA AND CULTURE HABITS
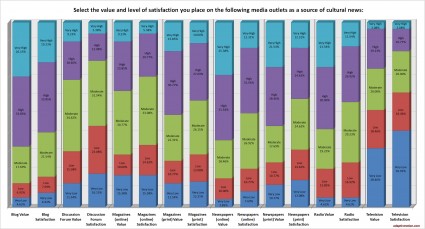
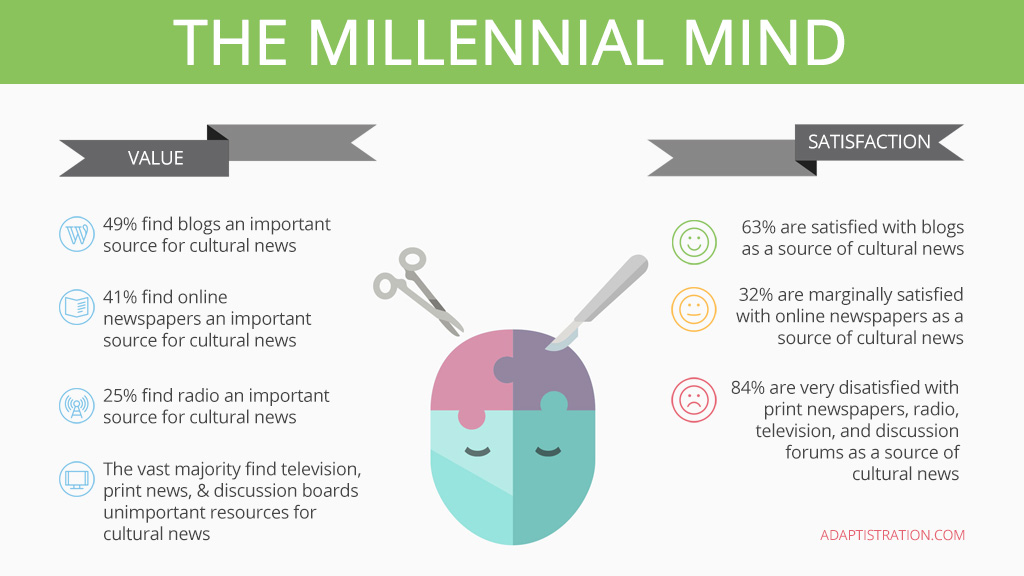
QUESTION: SELECT THE VALUE AND LEVEL OF SATISFACTION YOU PLACE ON THE FOLLOWING MEDIA OUTLETS AS A SOURCE OF CULTURAL NEWS:
Analysis
Of all the questions in this survey, this was one of the most useful in helping determine the influence of culture blogs and other new media formats compared to traditional media outlets. Half of all respondents indicate blogs, newspapers (online and print), and radio stations hold the greatest amount of value but when it comes to satisfaction, only blogs managed to garner a positive rating from at least half of respondents. Furthermore, none of the outlets earned a higher satisfaction over value rating with the exception of television which earned equally low ratings for value and satisfaction.
It is worth noting that respondents felt that radio outlets were just as valuable as print newspapers although both outlets earned a sharper decrease with satisfaction as compared to blogs and online newspapers. Overall, when considering the combined ratings of “high” and “very high” respondents ranked the outlets as follows:
Value
- 60% – Blogs
- 54% – Newspapers (online)
- 52% – Radio
- 50% – Newspapers (print)
- 45% – Magazines (print)
- 38% – Magazines (online)
- 28% – Discussion Forums
- 22% – Television
Satisfaction
- 53% – Blogs
- 44% – Newspapers (online)
- 38% – Radio
- 37% – Magazines (print)
- 36% – Newspapers (print)
- 26% – Magazines (online)
- 22% – Television
- 18% – Discussion Forums
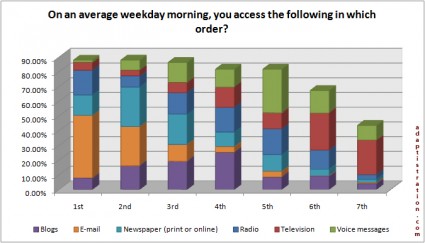
QUESTION: ON AN AVERAGE WEEKDAY MORNING, YOU ACCESS THE FOLLOWING IN WHICH ORDER?
Analysis
When it comes to morning routines, the majority of respondents indicate they check email and newspaper resources before any other outlets. Blogs and radio stations typically don’t enter the routine begin until shortly thereafter followed by voice messages and television.
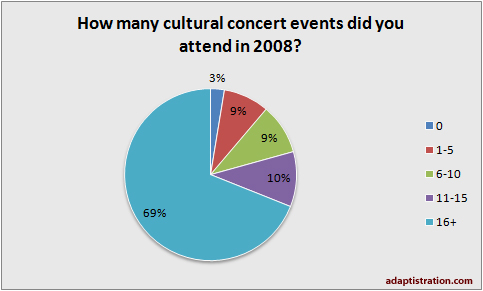
QUESTION: HOW MANY CULTURAL CONCERT EVENTS DID YOU ATTEND IN 2008?
Analysis
A strong majority of respondents attend live concert events no less than approximately once every three weeks. Cross tabulating indicates that within this ratio, those who identified themselves as Patrons attended this often 69.57 percent of the time while the same numbers of concerts attend by those who identified themselves as a board member was 50 percent. Those identifying themselves as managers attend most often at 74.55 percent.
SECTION #3: BLOG AND ONLINE HABITS
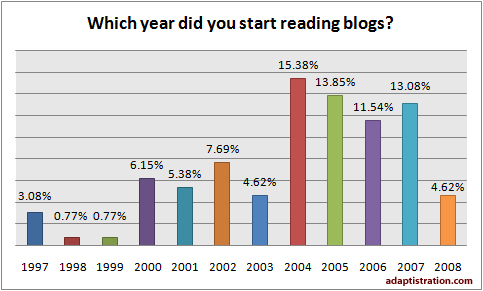
QUESTION: WHICH YEAR DID YOU START READING BLOGS?
Analysis
2004 witnessed the first sizeable spike in blog readership with lower percentages of new readers over the next three years at varying levels. Consequently, 2008 witnessed a drop in the numbers of new readers to levels akin to the first half of the decade.
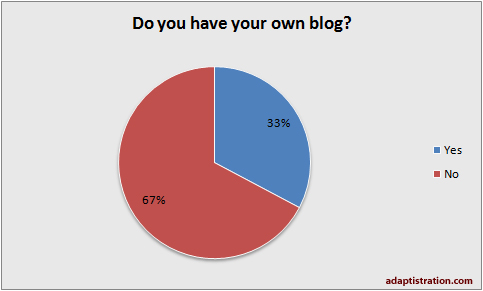
QUESTION: DO YOU HAVE YOUR OWN BLOG?
Analysis
The percentage of respondents who also blog came as a bit of a surprise. If anything, this ratio indicates that next year’s survey should explore whether or not these individuals maintain culture blogs and how frequently they publish content. Cross tabulating indicates that among those who maintain a blog, 42 percent identified themselves as ticket buyers, 39 percent are managers or staffers, 36 percent are professional musicians/artists/dancers, and there are even a handful of board members.
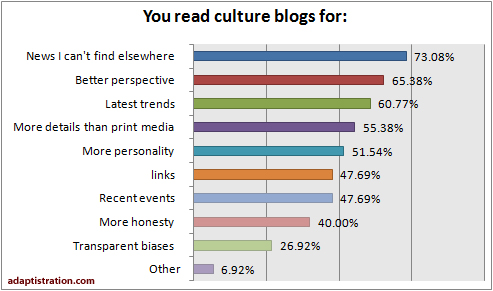
QUESTION: YOU READ CULTURE BLOGS FOR:
Analysis
This data is especially useful when cross tabulated with the data from the first question in Section #2 (value and satisfaction of media outlets). In fact, there is so much relevant data that there is a way to go before it will be completely processed. In particular, it will be interesting to see if there is enough information to shed more light on how readers determine value and satisfaction. In the meantime, the data indicates that culture blogs are covering a more diverse number of topics along with filling in gaps left behind by contracting print media coverage.
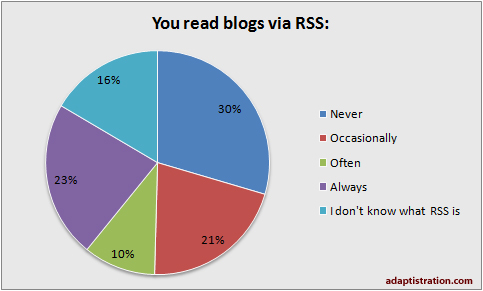
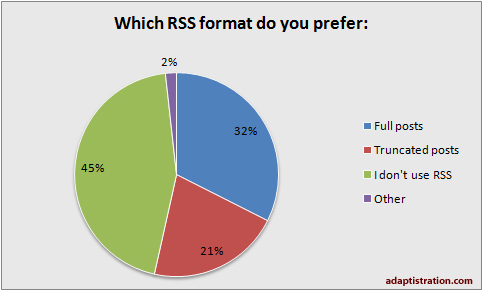
QUESTIONS: ON AVERAGE, HOW MANY BLOGS DO YOU READ DAILY AND DO YOU READ BLOGS VIA RSS; IF SO, WHICH FORMAT DO YOU PREFER?
Analysis
The data indicates no real surprises via frequency but RSS responses are a different matter. In March, 2008 I conducted a short reader survey to help define RSS usage. At that time 80 percent of respondents indicated they used RSS feeds, 12 percent did not use RSS feeds, and only 7.5 percent didn’t know about RSS feeds. Fast forward ten months and RSS feeds seem to be losing traction. The percentage of respondents who don’t know about RSS feeds has doubled while the numbers who don’t use RSS feeds at all has skyrocketed up to 30 percent. Meanwhile, among those who do use RSS feeds, the percentage preferring truncated over full posts increased by nearly 12 percent.
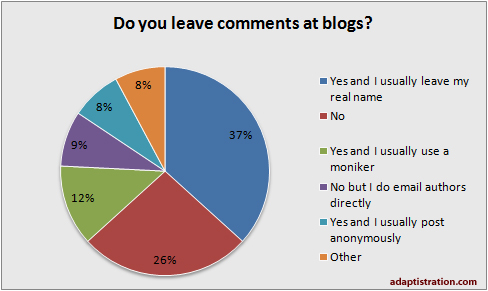
QUESTION: DO YOU LEAVE COMMENTS AT BLOGS?
Analysis
Arguably, one of the defining characteristics of blogs is the ability for readers to interact with each other as well as the author. Overall, 57 percent of respondents said they leave comments either with their real name, a moniker, or anonymously. Similarly, nine percent of readers prefer to limit interaction to email while only a quarter of readers do not interact in any fashion.
Observations
- Traditional and new media formats could do better at producing content that satisfies reader’s expectations.
- If trends in satisfaction levels remain unchanged, blogs could supplant traditional media outlets as the most valuable source for cultural news and opinion.
- People are more likely to learn about cultural news from an email message as opposed to finding it firsthand.
- Bloggers have a notable level of trust with regard to influencing recorded classical music purchases and potential interest in the decision making process to purchase live concert tickets. Comparatively, blogger influence related to charitable giving is not as strong but additional research is required to adequately explore potential.
- Infrequent recorded classical music buyers tend to be more likely to purchase CDs whereas frequent buyers prefer downloads nearly two to one.
- iTunes dominates the downloadable classical music market.
- Blog readers who visit 13 or more outlets per day are most likely to interact with others about culture related news, attend more live concert, and purchase more downloadable classical music than those who read less frequently.
- Erratic changes in levels of new blog readers over the past several years make it difficult to determine if numbers of incoming new readers will continue to fluctuate or level off.
- A blogger’s perspective and personality matter a great deal when attracting and maintaining readership.
- Comparative data about RSS usage indicates the need for additional study.
- Three quarters of blog readers interact with blog authors and other readers in one fashion or another.
If nothing else, the data helps to formulate additional questions; some of which may be examined later this year or in next year’s annual survey. In the meantime, what are your observations? Did you see something besides what is mentioned above? Do you disagree with these observations? Are you beginning to formulate a hypothesis? Can you identify areas where this information can be useful? It always helps to have as many eyes as possible to look over data like this and I’m curious to know more about how the information relates to your situation. As such, post a comment below or send in an email.
Thanks to all of the readers who took the time to complete the 2009 Readership Segmentation Survey. Tomorrow’s article will examine how readers have been interacting with Adaptistration along with reviewing topic suggestions and other popular related culture blogs.

2 thoughts on “Readership Survey Results Part 2”