Each year, one of the most popular items in the orchestra compensation reports is a big picture overview of all compensation alongside Total Expenditure figures. If you’ve been looking for something that shows all the report values in a single chart, this is your article.

16 Year Trends
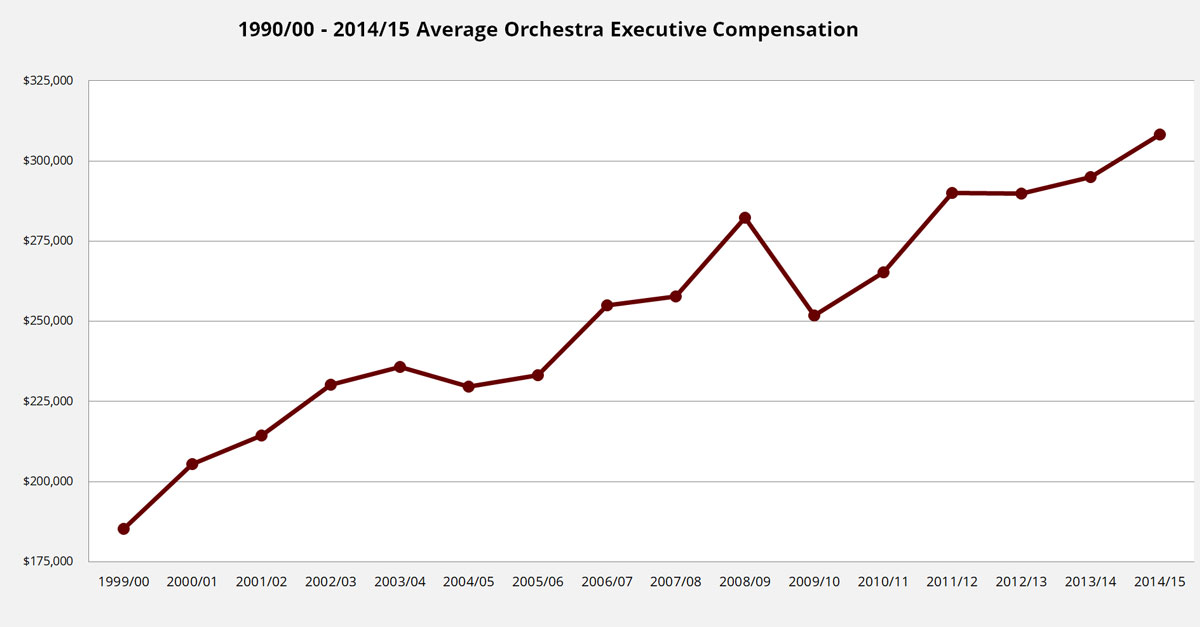
Although the Orchestra Compensation Reports have been around since 2005 (which covered the 2003/04 season) my 990 archive extends back through the 1999/00 season. Consequently, this overview article is an excellent vehicle for reaching back into those archives usually reserved for consulting work and extracting information to share.
To that end, I’m happy to say that this year’s installment will include a new dynamic charting tool that will make it easier to not only provide charts and graphs for changes in average compensation per stakeholder, but overlay them into a single chart. All of this makes it much easier to visualize the bigger picture (as an aside, keep your eyes out for some exciting news in August on this item).
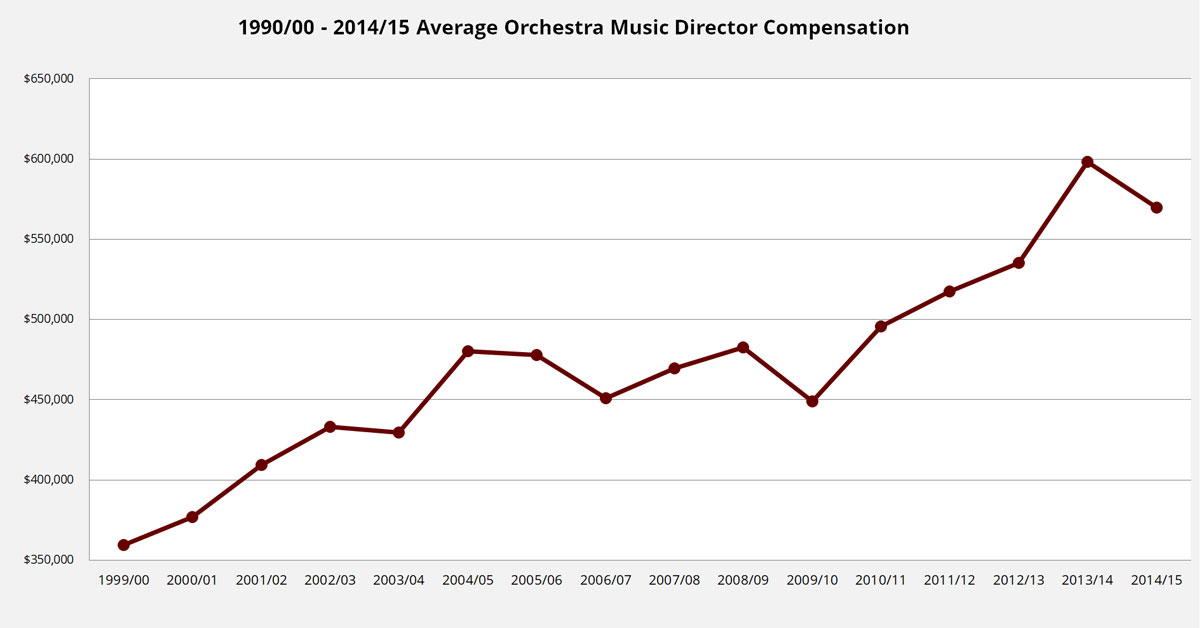
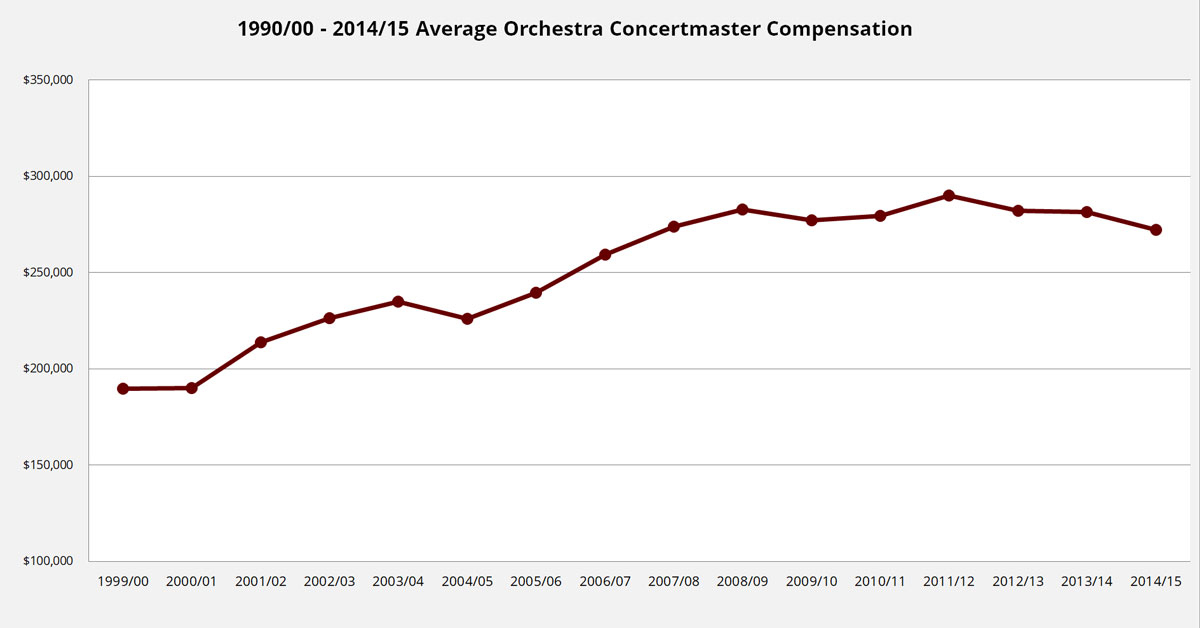
The Deliberation Continues
When the compensation reports were launched back in 2005, there was a great deal of reader discussion about the value of each stakeholder group along with questions about why they didn’t share comparatively equal gains and losses from one season to the next. In the wake of the economic downturn, those discussions began to wane but a few key areas have once again sparked that core discussion.
For example, the supposedly shared sacrifice of Philadelphia Orchestra’s CEO during their bankruptcy was quickly followed by a complete restoration and a host of bonuses and perks (details). Last year’s discovery of a $3,321,541 signing bonus for Dallas Symphony Orchestra’s music director during the 2013/14 season was tempered by the organization’s spokespersons by framing it as a one-time anomaly. Nonetheless, the following season produced 48.5 percent increase over 2012/13 compensation.
It will be fascinating to see whether or not there are any changes in how boards initially set and evaluate compensation for executive and music director stakeholders. Based on the patterns from the past few available seasons, there doesn’t appear to be much inclination to control those expenditures. For music directors in particular, the rate of increase in average compensation actually increased over the previous decade after a single year drop in the 2008/09 season.
Since its inception in 2005, the purpose of the Orchestra Compensation Reports is to help reinforce the value of transparency and inspire patrons to create a stronger connection with their local orchestra and how it functions.
To that end, it has been wonderful watching discussions across social media and other media outlets unfold. Yes, there’s always going to be an element of salaciousness but that quickly melts away into more meaningful discussions surrounding the systems used to determine whether the field is rewarding effort or achievement.
