Since the onset of coronavirus related shutdowns, orchestras have been laying off and reducing hours for administrators and musicians alike. We started measuring that impact in April 2020 using a weekly poll and after five months, the field has experienced various degrees of retraction.
Stakeholder Groups
- Administrators. This group includes all staffers and managers as well as music directors and other non-union artistic staff.
- Salaried Musicians. These musicians earn a fixed weekly salary along with health care benefits.
- Per-Service Musicians. These musicians are paid only during weeks they are used and have much shorter seasons. While a tiny ratio receives full heath care benefits, the vast majority do not.
What The Polls Measured
Each weekly poll asked stakeholders to identify their employment status.
Administrators:
- I am still working and being paid at my regular full time or part time status
- I am still working, but at reduced hours and pay
- I have been furloughed
- I have been laid off
- My position has been terminated
Salaried Musicians:
- I am being paid my regular salary and benefits
- I am being paid a reduced salary
- I am not drawing a salary but have health care benefits
- I am not drawing a salary nor health care benefits
Per-Service Musicians:
- I have not lost any income to cancelled services
- I am being paid the full amount for any services that were cancelled
- I am being paid for some of the services that were cancelled
- I am not being paid for any cancelled services
From here we could begin grouping responses for each stakeholder into three primary groups: fully employed, underemployed, or unemployed. While trends were easily identified, each stakeholder group entered the period of shutdowns at very different employment levels and progressed at sometimes wildly varying rates of change.
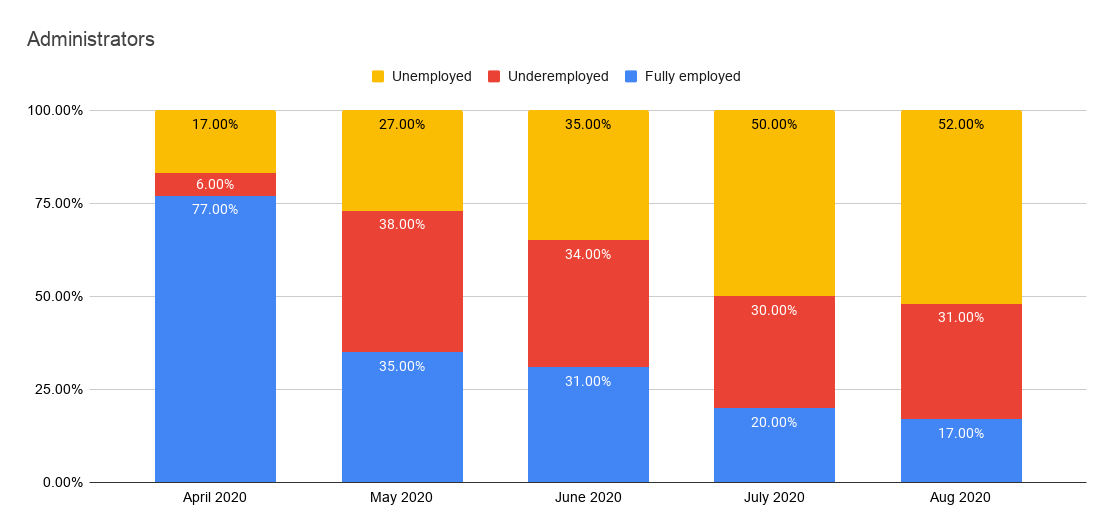
Administrator Results
This group followed what might be the most predictable path given that many orchestras managed to secure some form of Paycheck Protection Program (PPP) and/or Small Business Association (SBA) loans that helped minimize staffing reductions through June.

Things were looking solid throughout April, although a 17 percent reduction in staffing is still a serious drop. Starting in May, things started shifting toward much larger ratios of managers moving into underemployed status. By the end of June, approximately 1/3 of respondents indicating being employed at full status.
The bottom fell out in July as a larger share of underemployed managers moved into the unemployed group. By the end of August, just over half of respondents indicated being unemployed and only 17 percent were still working at full employment levels.
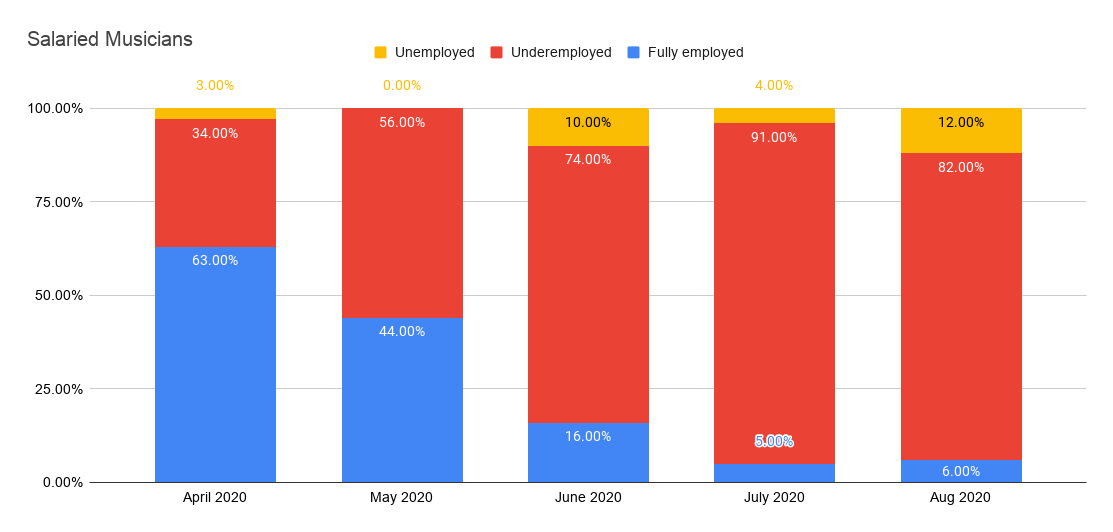
Salaried Musician Results
Even though this stakeholder group maintains a lower ratio of workers indicating full employment status, the average salaried musician still managed to fare better than their administrator counterparts. This was due mostly to the lion’s share of respondents indicating underemployed status and a comparatively small ratio falling into the unemployed category.

Much like administrators, April and May saw consistent employment levels but once June rolled around, ratios evolved into what would become this stakeholder’s pattern through the end of August. The vast majority of salaried musicians remain underemployed with small ratios maintaining full employment or becoming unemployed.
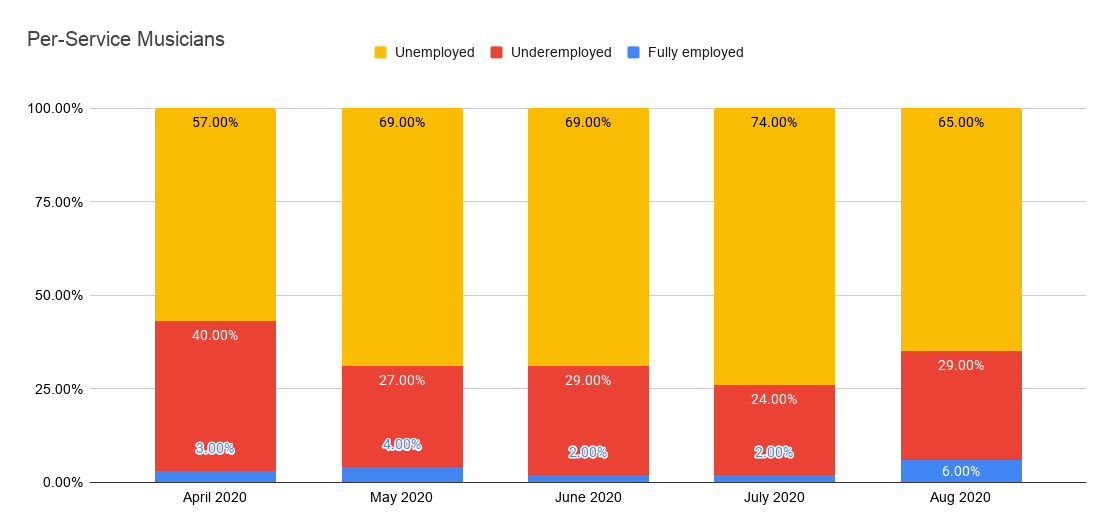
Per-Service Musician Results
There isn’t enough lipstick in the world to make this pig prettier. Without a doubt, per-service musicians bore the brunt of shutdowns.

Right out of the gate in April, just over half indicated moving into unemployed status with a scant three percent indicating being fully employed. By June, the ratio of unemployed increased to just under 3/4 and see-sawed around that proportion through August. There are no two ways about it, per-service musicians have been enduring a grim employment reality.
Details
Throughout the course of this project, each weekly result was cataloged into a publicly accessible Google sheet: Orchestra Stakeholder Employment Status During Coronavirus Shutdowns. The information there provides considerably more information than the monthly summaries above, which are designed to provide a better overall picture of employment status trends.
Once there, you’ll find interactive versions of the following step charts illustrating weekly changes in employment status for each stakeholder group.
Administrators:

Salaried Musicians:

Per-Service Musicians:

Looking Ahead
Now that employment statuses have seemingly stabilized across each stakeholder group, we’ll begin using this as a new benchmark for measuring monthly changes. While details are still being worked out, you can expect the first survey at the end of the month.

