Each year, one of the most popular items in the orchestra compensation reports is a big picture overview of all compensation alongside Total Expenditure figures. If you’ve been looking for something that shows all the report values in a single chart, this is your article.
| wdt_ID | ENSEMBLE | Total Expenditures | Executive Compensation | Music Director Compensation | Concertmaster Compensation |
|---|---|---|---|---|---|
| 1 | Alabama Symphony | $6,676,864 | $123,000 | $197,746 | $122,724 |
| 2 | Albany Symphony | $2,721,556 | $116,466 | $130,000 | NA |
| 3 | Allentown Symphony | $3,243,100 | NA | NA | NA |
| 4 | Atlanta Symphony* | $107,113,113 | $380,289 | $708,326 | $258,548 |
| 5 | Austin Symphony | $5,457,069 | $174,715 | $175,119 | NA |
| 6 | Baltimore Symphony | $25,734,452 | $332,951 | $756,911 | $296,733 |
| 7 | Boston Symphony | $109,772,097 | $1,040,949 | $1,787,000 | $513,266 |
| 8 | Buffalo Philharmonic | $12,507,861 | $229,469 | $330,389 | NA |
| 9 | Charlotte Symphony | $10,157,862 | $254,785 | $234,917 | NA |
| 10 | Chattanooga Symphony | $2,580,262 | $90,306 | NA | NA |
| 11 | Chicago Symphony | $78,697,891 | $564,516 | $3,420,804 | $573,698 |
| 12 | Cincinnati Symphony | $33,288,825 | $400,826 | $555,813 | $310,708 |
| 13 | Cleveland Orchestra | $57,988,415 | $952,523 | $1,485,371 | NA |
| 14 | Colorado Springs Philharmonic | Not Reported | Not Reported | Not Reported | NA |
| 15 | Colorado Symphony | $14,407,985 | $363,796 | $219,723 | $123,855 |
| 16 | Columbus Symphony | $8,259,235 | NA | $236,240 | NA |
| 17 | Dallas Symphony | $33,947,391 | $457,138 | $911,024 | $329,629 |
| 18 | Dayton Philharmonic* | $7,705,334 | $136,396 | $180,540 | NA |
| 19 | Detroit Symphony | $35,606,065 | $467,857 | NA | $226,329 |
| 20 | Florida Orchestra | $11,229,576 | $268,874 | $283,000 | $139,629 |
| 21 | Fort Wayne Philharmonic | $5,932,830 | $188,567 | $141,885 | NA |
| 22 | Fort Worth Symphony | $12,870,844 | NA | $308,732 | $114,726 |
| 23 | Grand Rapids Symphony | $10,914,975 | $109,808 | NA | NA |
| 24 | Harrisburg Symphony | $2,880,404 | $159,515 | $217,713 | NA |
| 25 | Hartford Symphony | $5,365,442 | $124,306 | $164,749 | NA |
| 26 | Houston Symphony | $33,147,136 | $335,264 | $459,132 | NA |
| 27 | Indianapolis Symphony | $32,118,817 | NA | $566,028 | $260,896 |
| 28 | Jacksonville Symphony | $11,090,763 | NA | NA | NA |
| 29 | Kalamazoo Symphony | $3,916,408 | $184,202 | NA | NA |
| 30 | Kansas City Symphony | $19,428,025 | $320,099 | $444,029 | NA |
| 31 | Knoxville Symphony | $4,142,104 | $128,116 | NA | NA |
| 32 | Los Angeles Chamber Orchestra | $4,774,234 | $198,887 | NA | NA |
| 33 | Los Angeles Philharmonic | $166,254,625 | $897,508 | $2,857,103 | $564,237 |
| 34 | Louisville Orchestra | $7,454,129 | NA | $223,333 | NA |
| 35 | Memphis Symphony | $4,121,855 | $109,809 | $174,599 | NA |
| 36 | Milwaukee Symphony | $17,889,830 | $315,474 | NA | $175,040 |
| 37 | Minnesota Orchestra | $36,668,040 | NA | $1,036,622 | $282,245 |
| 38 | Nashville Symphony | $27,421,525 | $396,995 | $511,818 | $225,732 |
| 39 | National Symphony* | NA | $475,846 | NA | $424,158 |
| 40 | New Jersey Symphony | $14,179,270 | $235,511 | NA | $209,756 |
| 41 | New York Philharmonic | $79,928,470 | $1,455,594 | $816,375 | $629,738 |
| 42 | North Carolina Symphony | $16,315,140 | $346,182 | $221,000 | NA |
| 43 | Oakland Symphony | $2,922,927 | $80,865 | $121,490 | NA |
| 44 | Omaha Symphony | $8,748,123 | NA | $180,000 | NA |
| 45 | Orchestra Iowa | $2,650,599 | $109,289 | $105,844 | NA |
| 46 | Oregon Symphony | $19,855,371 | $384,422 | $389,454 | $190,029 |
| 47 | Orlando Philharmonic | $4,244,779 | NA | NA | NA |
| 48 | Pacific Symphony | $21,020,831 | $354,735 | $481,049 | NA |
| 49 | Pasadena Symphony | $4,520,922 | $175,000 | NA | NA |
| 50 | Philadelphia Orchestra | $51,535,002 | NA | $1,672,167 | $470,507 |
| 51 | Phoenix Symphony | $13,567,945 | $431,449 | $270,750 | NA |
| 52 | Pittsburgh Symphony | $36,068,188 | $437,343 | $728,125 | NA |
| 53 | Portland (ME) Symphony | $3,609,101 | $111,950 | NA | NA |
| 54 | Richmond Symphony | $6,514,706 | $138,786 | $130,823 | $119,375 |
| 55 | Rochester Philharmonic | $10,339,899 | $219,970 | $260,810 | NA |
| 56 | Saint Louis Symphony | $29,391,582 | $421,623 | $710,664 | $302,387 |
| 57 | San Antonio Symphony | $8,114,690 | NA | $306,781 | NA |
| 58 | San Diego Symphony | $29,246,097 | $429,513 | NA | $259,516 |
| 59 | San Francisco Symphony | $79,786,312 | $968,107 | $2,139,720 | $587,876 |
| 60 | Santa Rosa Symphony | $4,049,629 | $220,536 | NA | NA |
| 61 | Sarasota Orchestra | $10,877,073 | $208,344 | $169,062 | NA |
| 62 | Seattle Symphony | $33,247,562 | NA | $592,669 | NA |
| 63 | Spokane Symphony | $5,477,114 | $154,591 | $143,859 | NA |
| 64 | St. Paul Chamber Orchestra | $11,185,907 | $307,661 | $273,244 | $237,029 |
| 65 | Symphony Silicon Valley | $3,243,348 | $150,000 | NA | NA |
| 66 | Toledo Symphony | $6,362,845 | $196,527 | $153,248 | NA |
| 67 | Tucson Symphony | $5,189,168 | $119,666 | $109,500 | NA |
| 68 | Utah Symphony | $23,321,569 | $405,552 | $492,768 | $237,279 |
| 69 | Virginia Symphony | $6,497,094 | $177,493 | $163,000 | NA |
| 70 | West Virginia Symphony | $2,708,531 | $134,973 | NA | NA |
| 71 | Averages | $22,473,628 | $327,630 | $575,511 | 303,172 |
Did you know? Direct links to most of the orchestra’s financial disclosure documents at guidestar.org are available in the Orchestra Financial Reports or you can save yourself dozens of hours by picking them up by season at the Adaptistration Store.
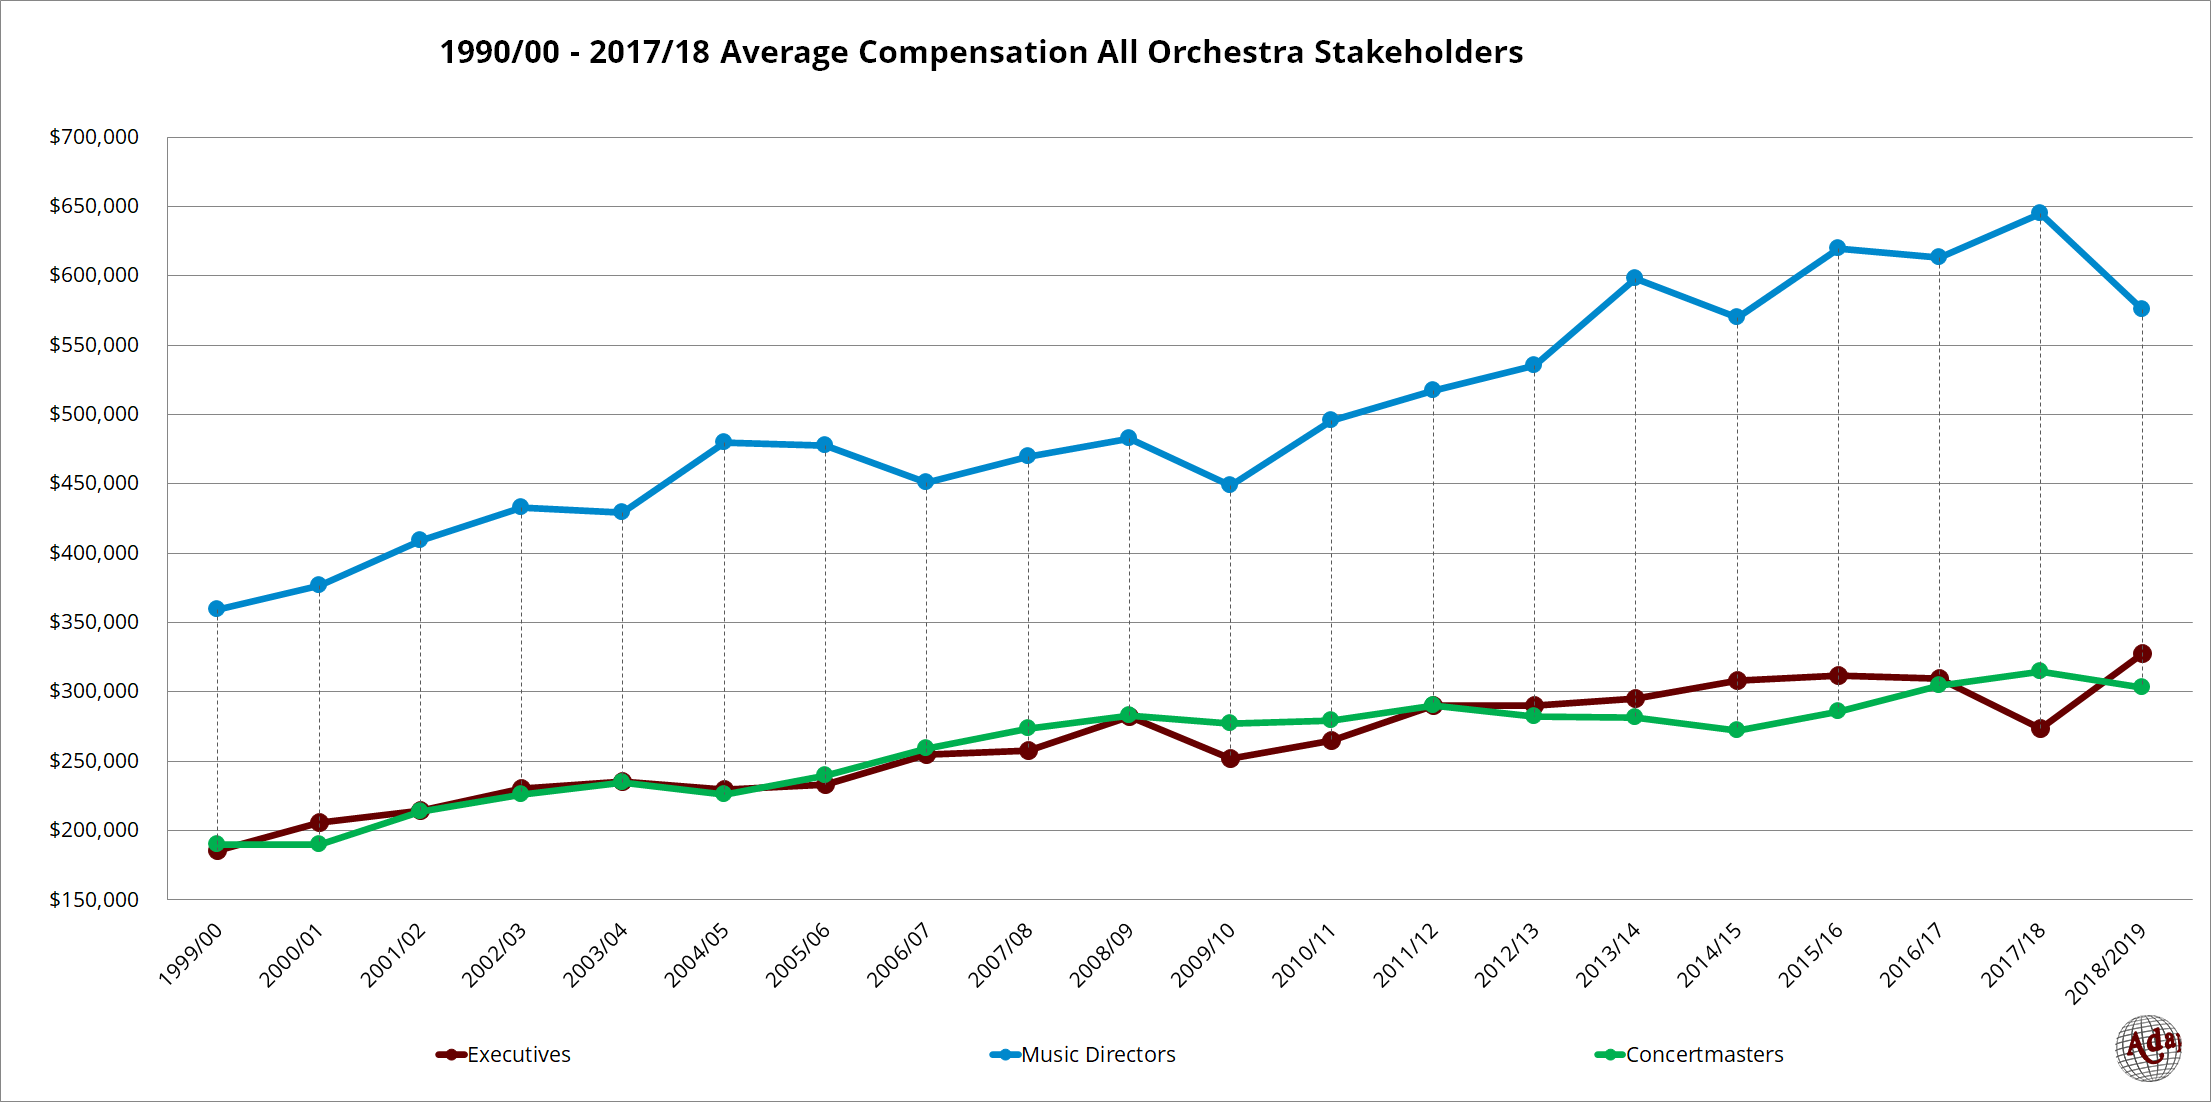
20 Year Trends
Although the Orchestra Compensation Reports have been around since 2005 (which covered the 2003/04 season) my 990 archive extends back through the 1999/00 season. Consequently, this overview article is an excellent vehicle for reaching back into those archives, which are usually reserved for consulting work, and extracting information to share.
To that end, let’s take a look at how each stakeholder group has fared over the years.
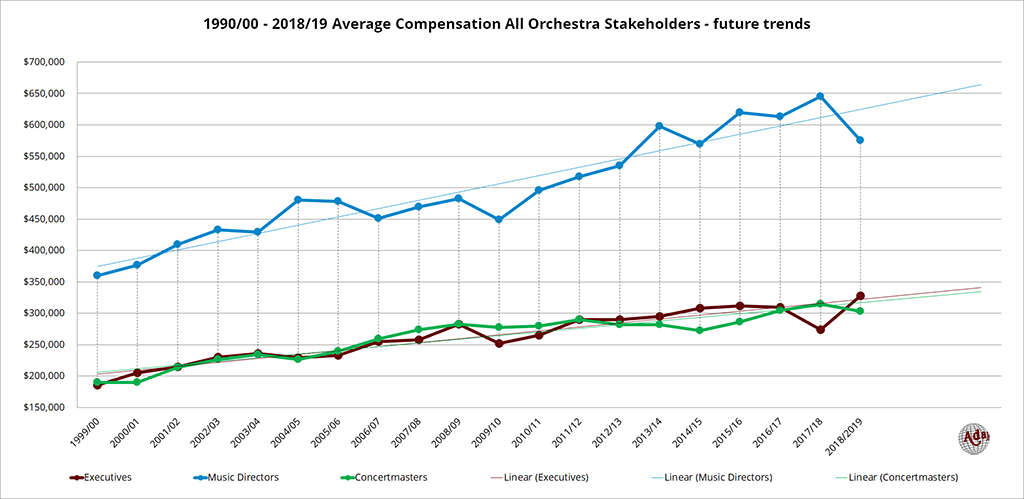
While the whipsaw patterns the last few year make things a little less clear, adding some trendlines projected over the next three years help make it clear where you can expect things to go.
At the same time, the next two reports include pandemic years so it’s quite likely we’ll see some of these figures reset. What is even more interesting are the next three years after that and whether each stakeholder will realign with historic trends or if the pandemic genuinely shook things up in a permanent sense.
The Deliberation Continues
When the compensation reports were launched back in 2005, there was a great deal of reader discussion about each stakeholder group’s respective value. Those were paired with questions about why stakeholder groups didn’t share comparatively equal gains and losses across seasons.
Since its inception, the purpose of the Orchestra Compensation Reports is to help reinforce the value of transparency and inspire patrons to create a stronger connection with their local orchestra and how it functions.
To that end, it has been wonderful watching discussions across social media and other media outlets unfold, doubly so during a period where the sector is just now starting to emerge from an enormously challenging time.
Yes, there’s always going to be an element of salaciousness that comes with reviewing compensation but that quickly melts away into more meaningful discussions surrounding the systems used to determine whether the field is rewarding effort or achievement.
Related Posts
-
Each year, one of the most popular items in the orchestra compensation reports is a big picture overview of all compensation alongside Total Expenditure…
-
Each year, one of the most popular items in the orchestra compensation reports is a big picture overview of all compensation alongside Total Expenditure…
-
When it comes to executive compensation, last year's artificially low average change (-11.62%) was offset by an equally artificial increase (19.74%). Having said that,…


