In today’s operating environment, there are no shortages of anxiety triggers. Having said that, it’s not like we should be going out of our way to pile on. Case in point: I’m seeing a lot of static analysis generated alarmism.
One of the best examples of this are a few articles making the rounds that all but guarantee social distancing (mandated or otherwise) will make ticket revenue all but useless.
The premise is that six-feet minimums will create such a checkerboard effect that halls will only be able to sell 15-20 percent of max seats. Here’s one of the illustrations floating around:
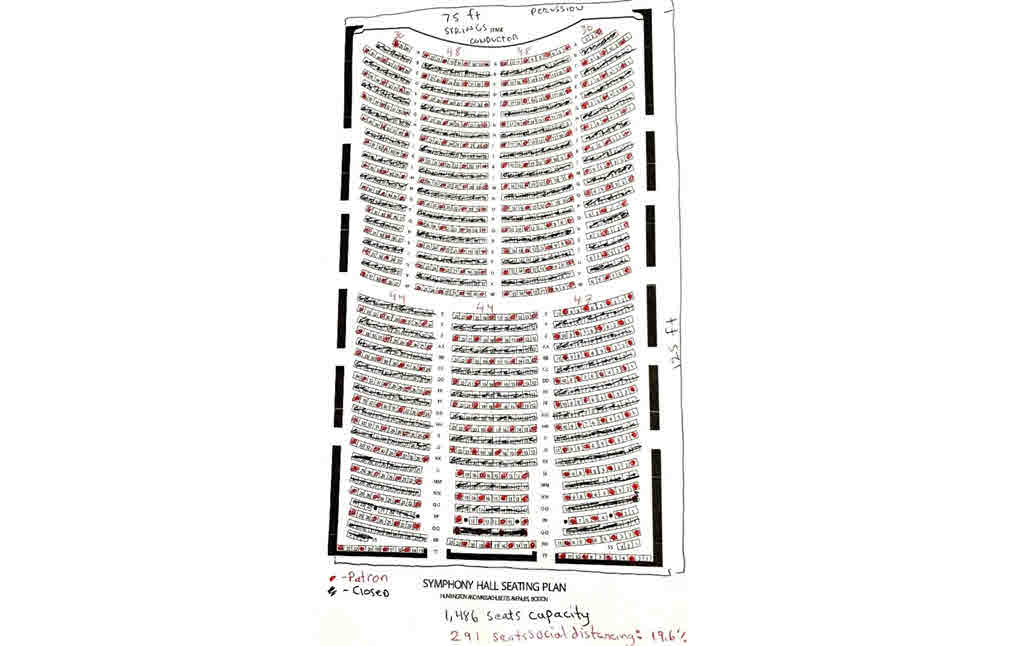
I’m, not going to call out the author because that’s not the point. More importantly, the overall concerns being discussed in the source article are entirely valid. Enough so that they are something everyone should be paying attention to.
At the same time, the above image is a great example of where dynamic analysis would produce a more realistic result.
Static vs. Dynamic Analysis
Static analysis typically considers variables are more equal than not whereas dynamic analysis takes into consideration how variables impact each other.
When applied to ticket sales, the primary variable is each ticket buyer requires an equal amount of surrounding space to meet social distancing requirements.
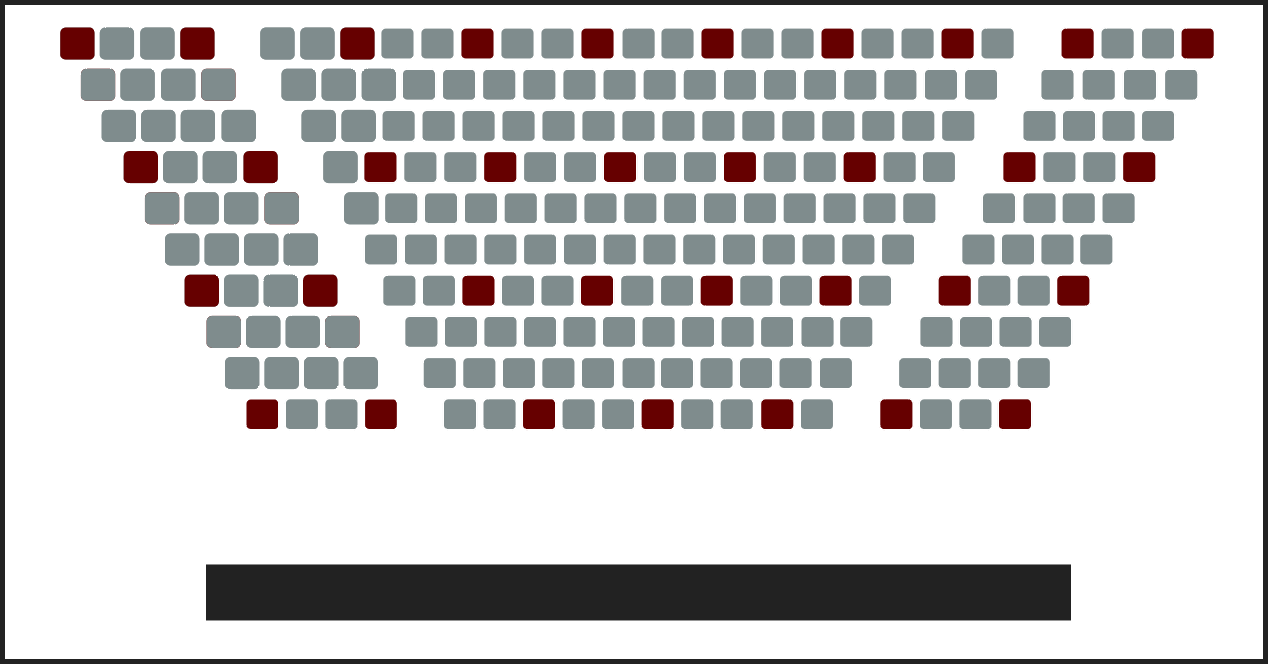
Let’s apply both approaches using a test seating chart with a maximum of 225 seats.
In the seating chart scenario above, it applied a solid static analysis approach by surrounding each patron with an equal amount of social distance on all sides. When applying the same parameters to our test chart, we ended up with 34 seats, or approximately 15 percent of the hall. That’s right around where most of the static analysis examples I’ve seen peg max capacity (15-20 percent).
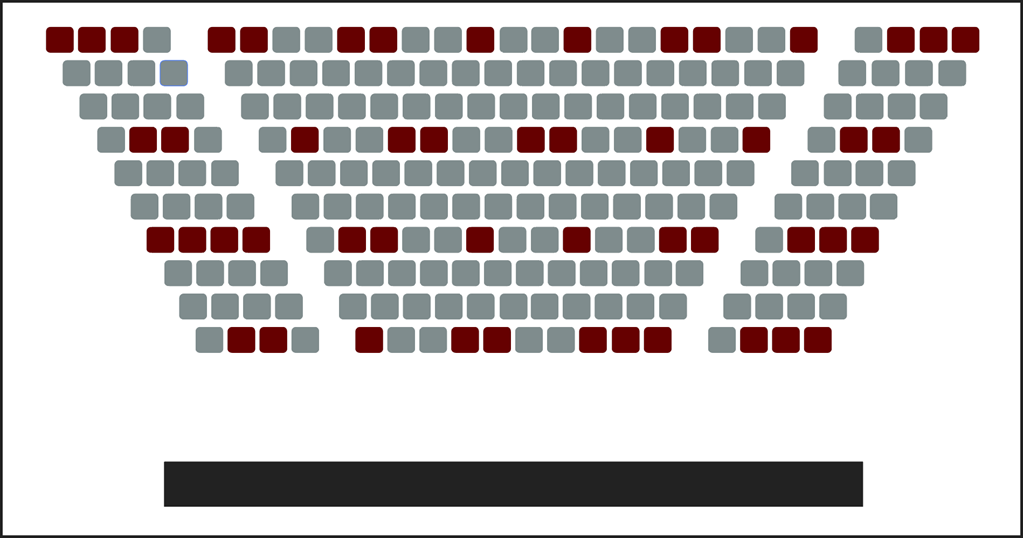
Dynamic analysis will take into consideration that some ticket buyers will be from the same household and pose no more or less risk to themselves or others by purchasing adjacent seating (a tactic airlines apply). From this perspective, it’s entirely reasonable to end up with a scenario dominated by couples and singles with a scattering of trios and quartets. This produces a 22 percent of hall result with 50 tickets sold:
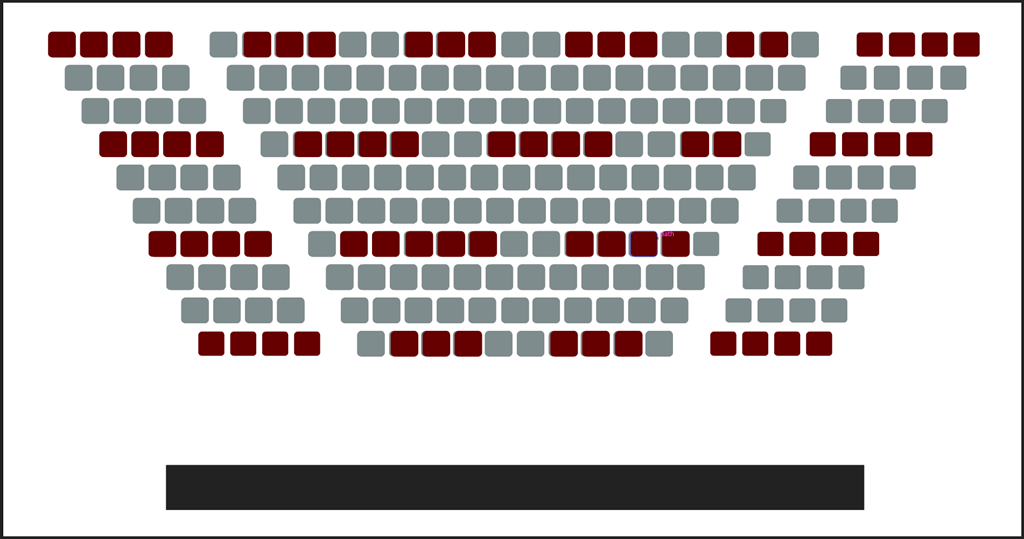
We can continue to tweak this approach with a rosey dynamic scenario that assumes most buyers are from a quartet household to get the ratio up to 30 percent of the hall at 68 tickets sold.
Show of hands: how many groups have seen shows sell at only 30 percent?
Yes, only selling 25-30 percent of your hall for several months to a full year is still grim. But it’s a different story compared to the static analysis outcome that maxes out at 15 percent. If anything, static analysis models should serve be your worst case scenarios, but not a foregone conclusion.
And since actual seating policies based on state or local government social distancing orders have yet to materialize, we don’t know for certain what guidelines organizations will be obliged to follow.
Having said all of that, the purpose of this post isn’t to belittle or put a false sense of security where things may lead.
Ideally, your organization is already exploring opportunities to expand earned income revenue streams to help mitigate those potential shortfalls.
At the same time, your box office staff should be looking at existing subscribers and finding ways to go all ninja on maximizing revenue by applying dynamic analysis to fit in as many of those planned sales into the hall as possible. From there, make the remaining seats available to single ticket buyers and scale accordingly to offer favorable pricing to as large of same household groups as possible.
