The Readership Segmentation Surveys routinely produce intriguing insight and this year was no exception. Having said that, it’s been a few years since our last examination and the added time gap produced some eye-opening perspectives.
Demographics & Occupation
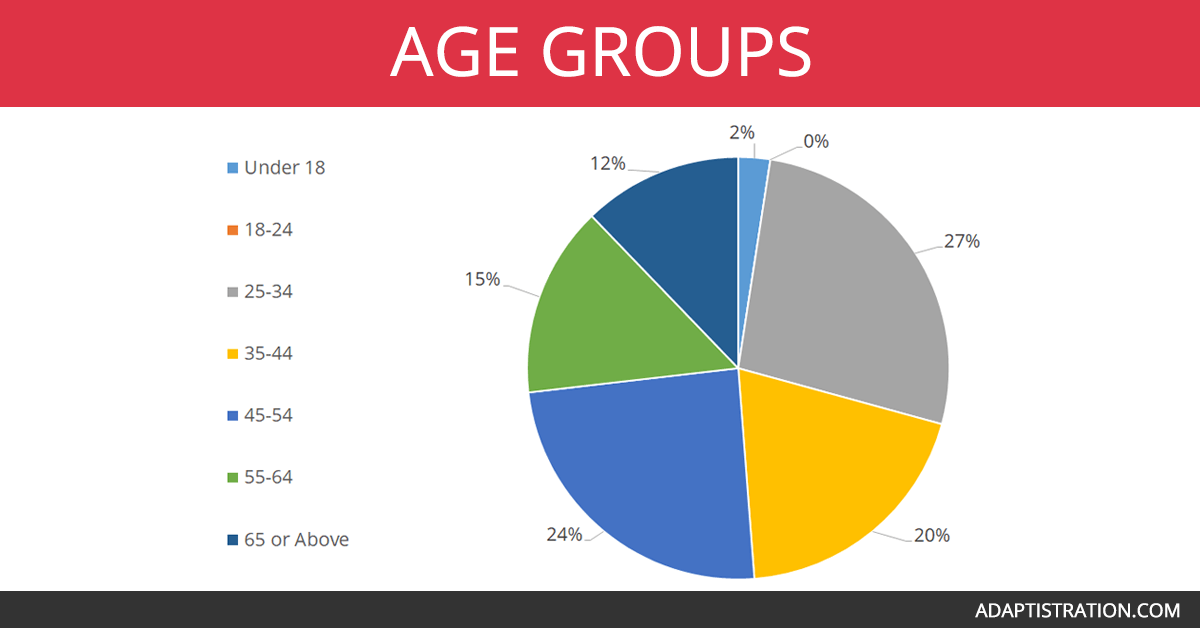
Direct reader responses confirmed something Google Analytics has been indicating in that the division of readers across age groups is beginning to flatten out from when Millennials dominated. For 2019, the bulk of readers were distributed across the middle age groups with the largest increase coming from the 45-54 age group.
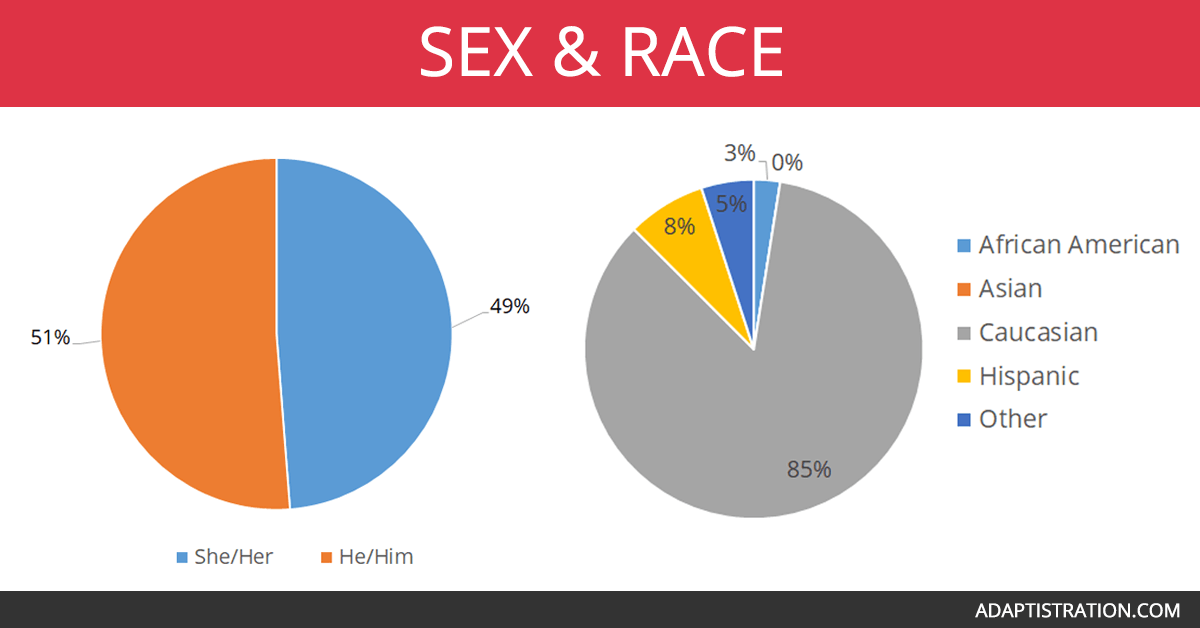
One change in the 2019 survey was moving from a traditional male/female response toward self-identification via pronoun. That being said, all respondents selected from the he/him and she/her options, which introduces the potential for including sexual orientation as a new benchmark for measuring diversity in the subsequent survey. The division of readers continued historical trends by moving closer to an equal distribution between readers identifying as he/him and she/her.
In 2015, 80 percent of readers identified as Caucasian and in 2019, that increased to 85 percent. This was the first time in seven years the slow progress toward a more diverse readership slipped.
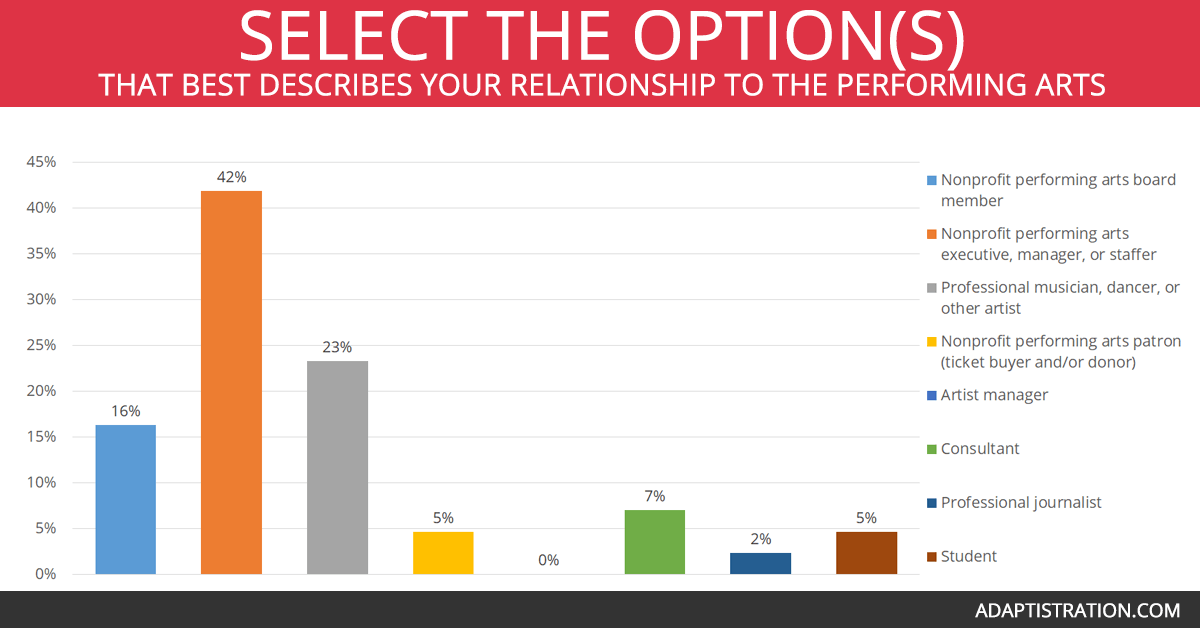
Over the years, one area where Adaptistration readers have remained consistent is the division between board members, administrators, and musicians. Having said that, 2019 saw those identifying as a professional musician, dancer, or other artist drop to its lowest ratio since we started tracking readership. That sector dropped from 32 to 23 percent of readers. The bulk of that shift was distributed among increases in those identifying as nonprofit performing arts board members and nonprofit performing arts executives, managers, or staffers.
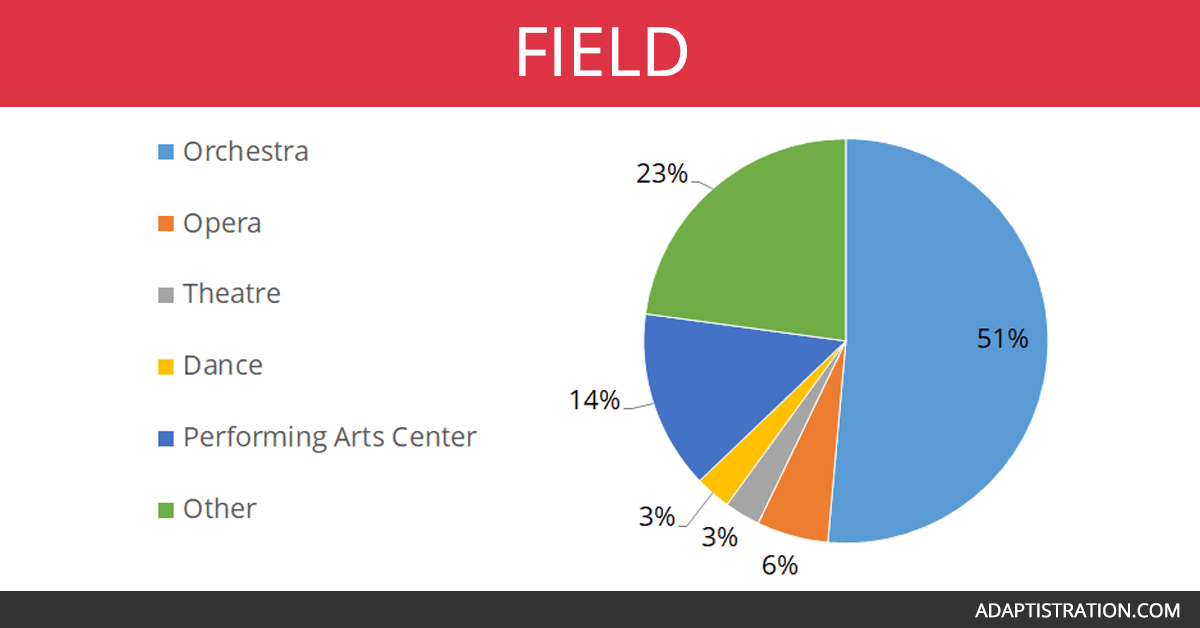
Another surprising change was the increase in readers who work outside the orchestra sector. Readers working at Performing Arts Centers and Other institutions nearly doubled. Among the latter, more than half indicated they work in the Chorus sector.
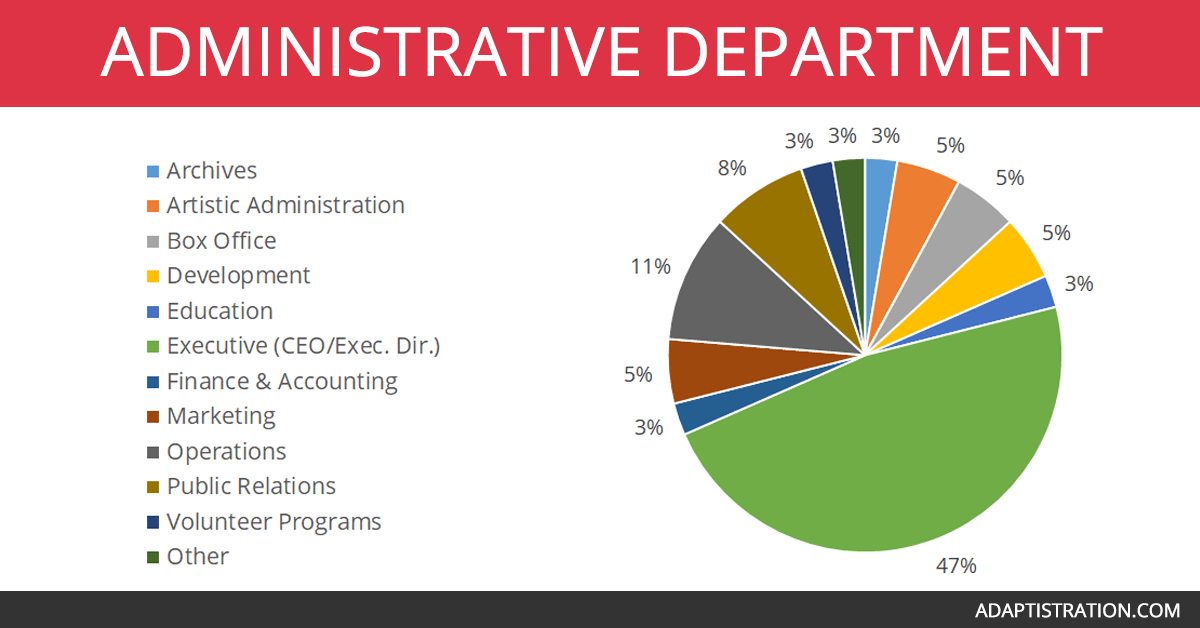
In a boomerang effect, the ratio of readers who identified as an executive or CEO jumped from 20 to 46 percent. The last time we saw that high of a percentage of executive readers was 2013. That change was offset by decreases in readers from Marketing and Education departments while Box Office, Artistic Admin, and PR all saw small increases.
Value & Satisfaction
One of the most valuable elements from the survey is measuring where readers go for culture news and how satisfied they are with those outlets.
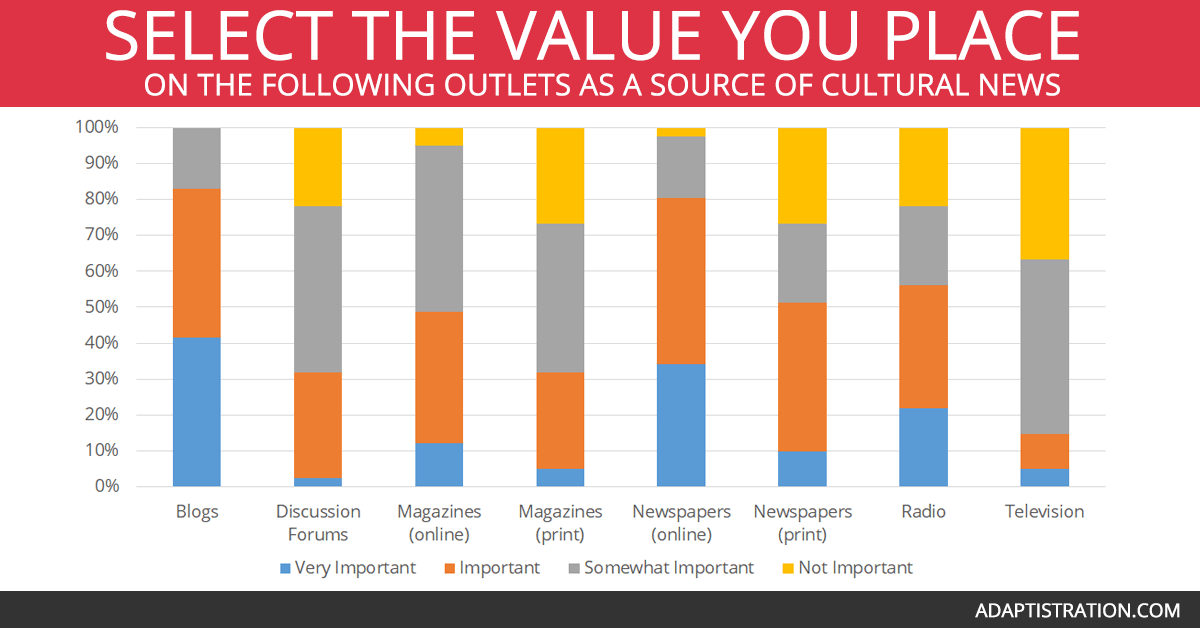
While culture blogs continue to dominate as the outlet of choice with the highest reader value, the level of those indicating they are “very important” dropped by more than half. Online newspapers become slightly more important than in 2015 while discussion forums and online magazines became substantially less important outlets.
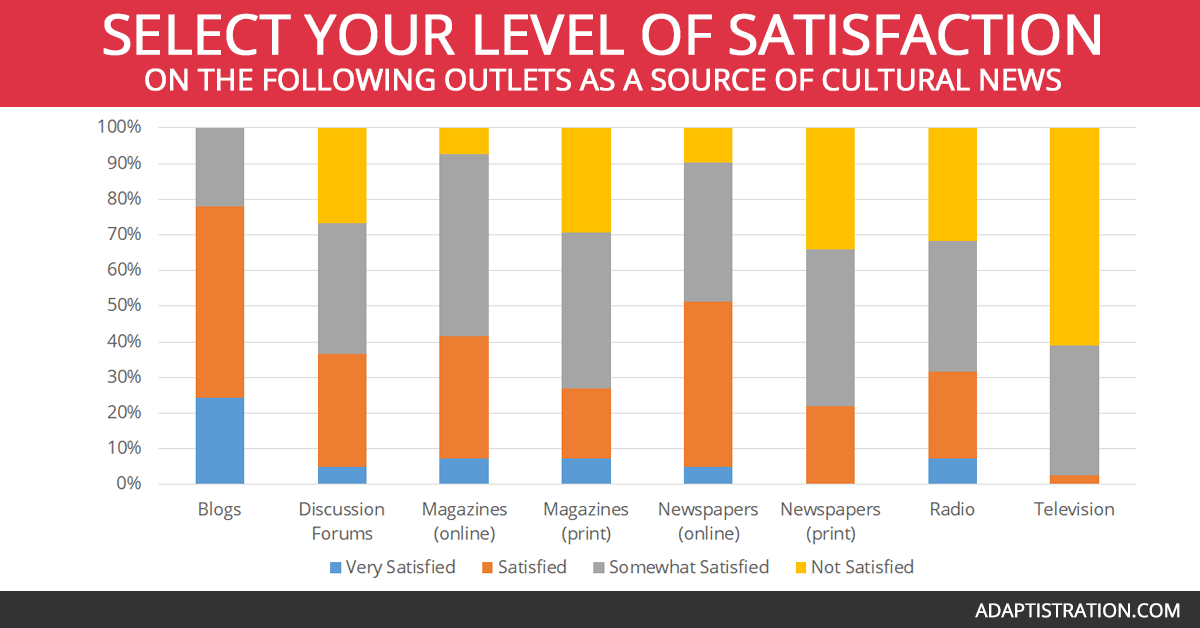
Overall, satisfaction levels were down across all categories. Of note is while readers placed more value on print newspapers in 2019 than in 2015, their satisfaction with that platform sank to an all-time low. At the same time, satisfaction with their online counterpart saw a slight increase. Culture blogs saw fewer readers assigning the highest satisfaction level but an overall decrease in those who were somewhat satisfied or not satisfied at all.
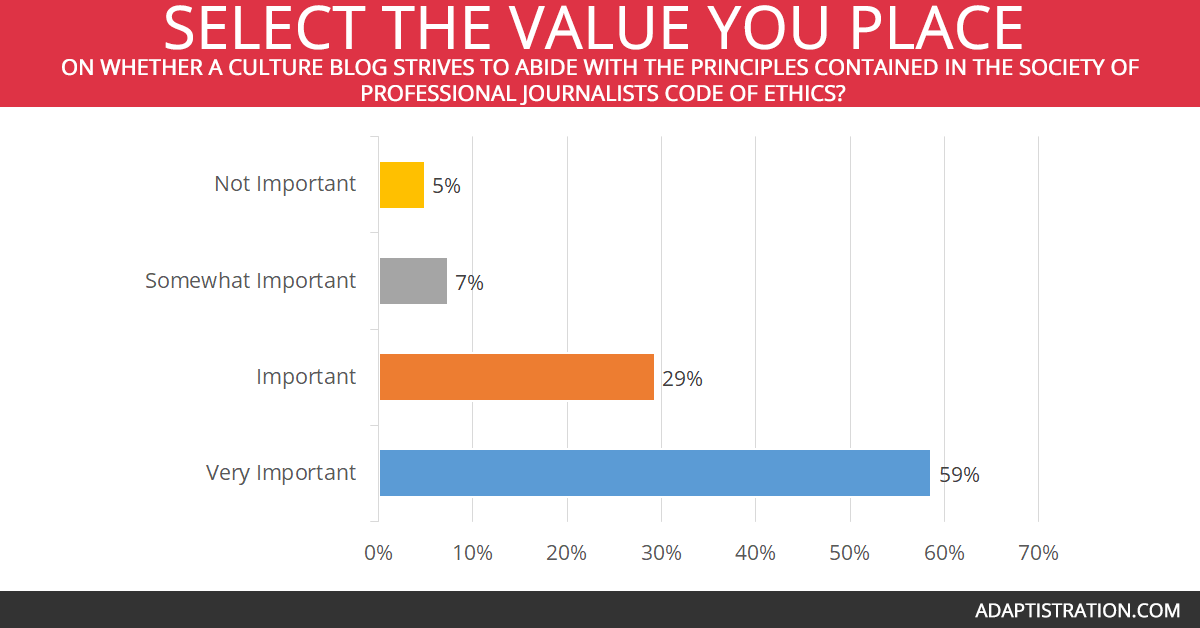
Among all the 2019 results, I found the increase in readers who hold culture blogs to high ethical journalistic standards heartening. Those who found ethics very important increased from 51 to 59 percent while those only found them somewhat or not important decreased by more than half. The move away from apathy is a very good thing by any benchmark.
Engagement
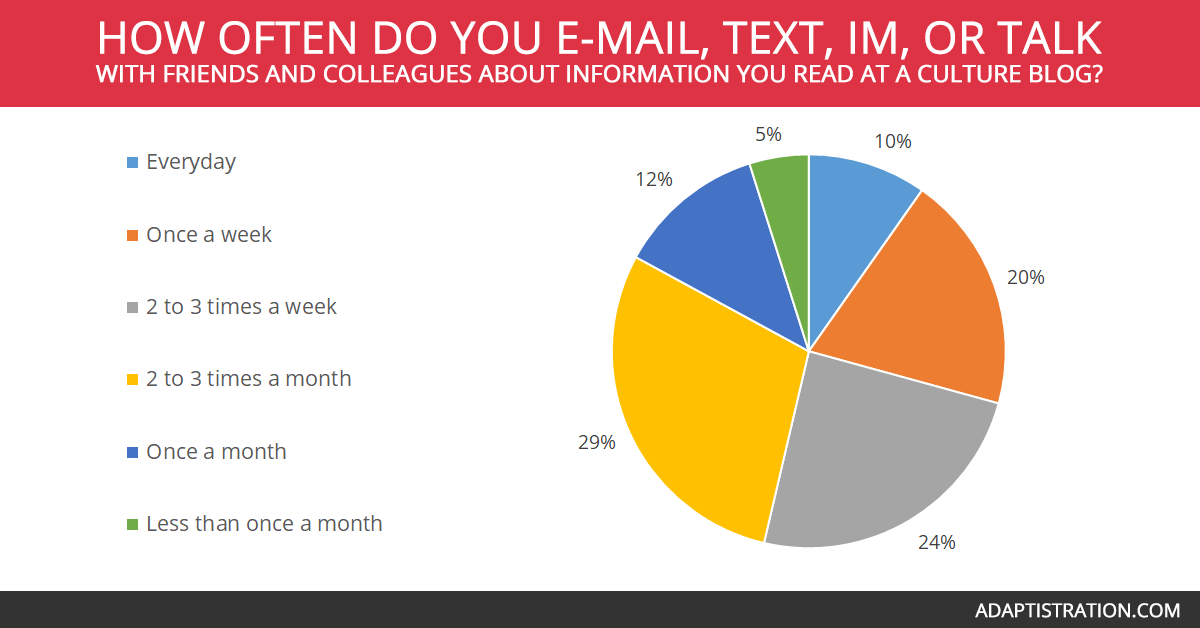
How often readers share content via social media continued a slow trend toward less is more. The biggest change is the increase of readers who engage a few times per month which went from 12 to 29 percent of respondents.
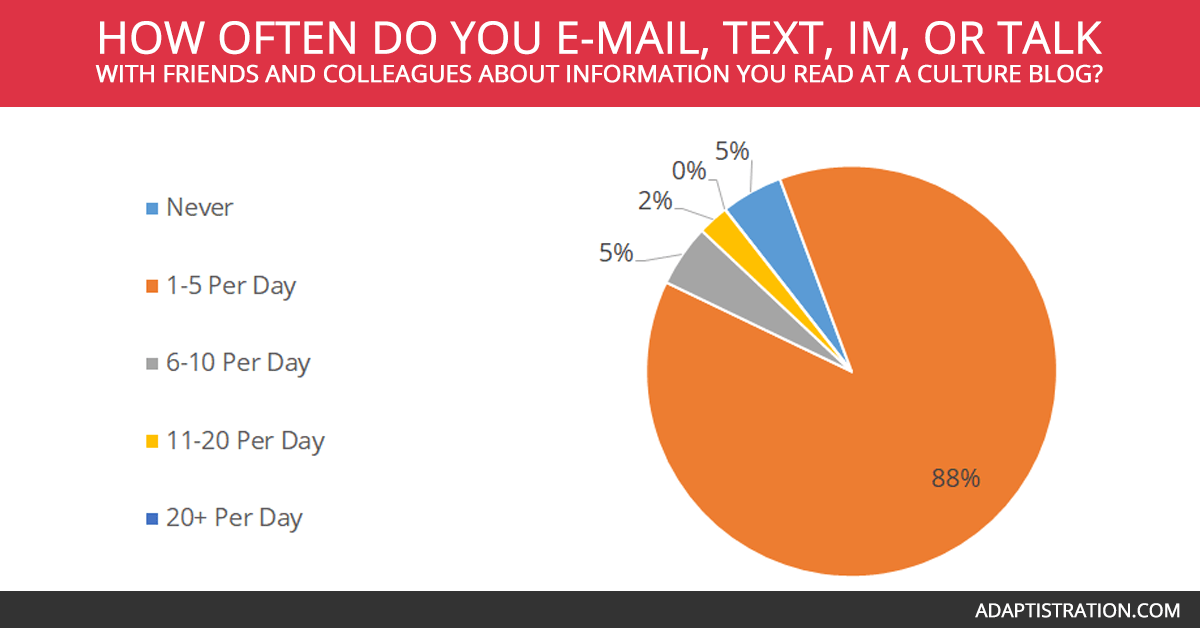
In conjunction with slightly less engagement, readers have been pairing back on the number of culture blogs they read on a regular basis. In 2015, 14 percent read 6-10 blogs per week but in 2019 that dropped to only five percent. The vast majority of users only read a few blogs each day.
What would be fascinating to learn, but more difficult to measure, is how much time they spend per outlet. For example, are they spending more time at fewer outlets or setting aside similar amounts of time per day but consuming less content.
But Why?
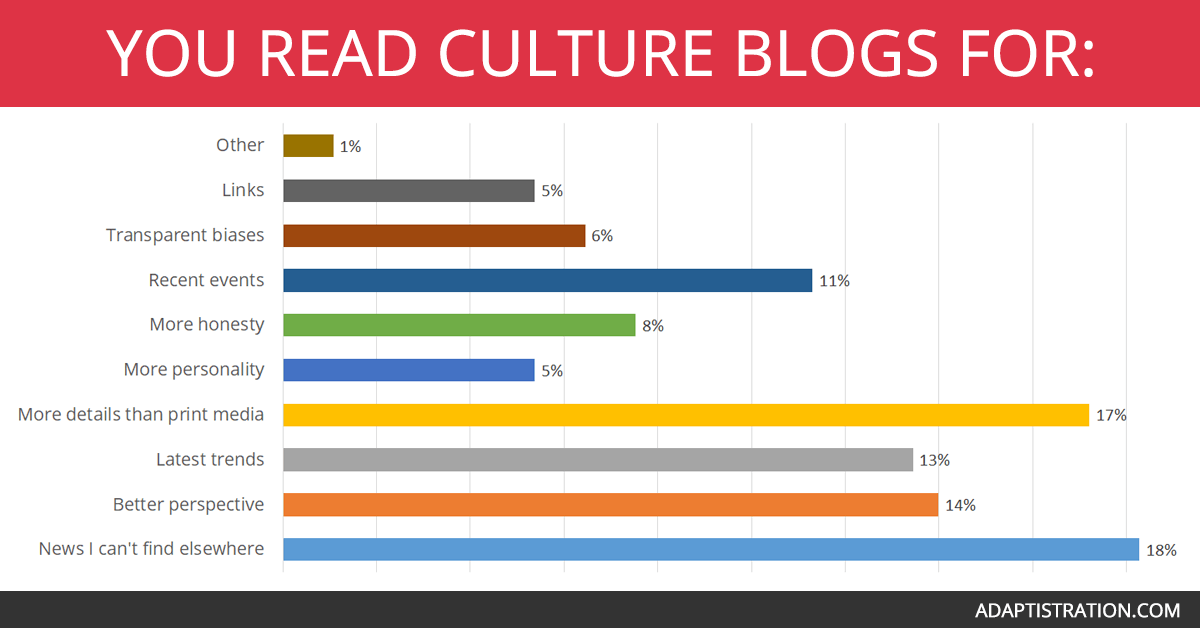
One area that saw little change are the reasons why readers engage with culture blogs. Substance, rarity, timeliness, and details still drive decision making. Those are all very good things.
Getting Here And Getting Around
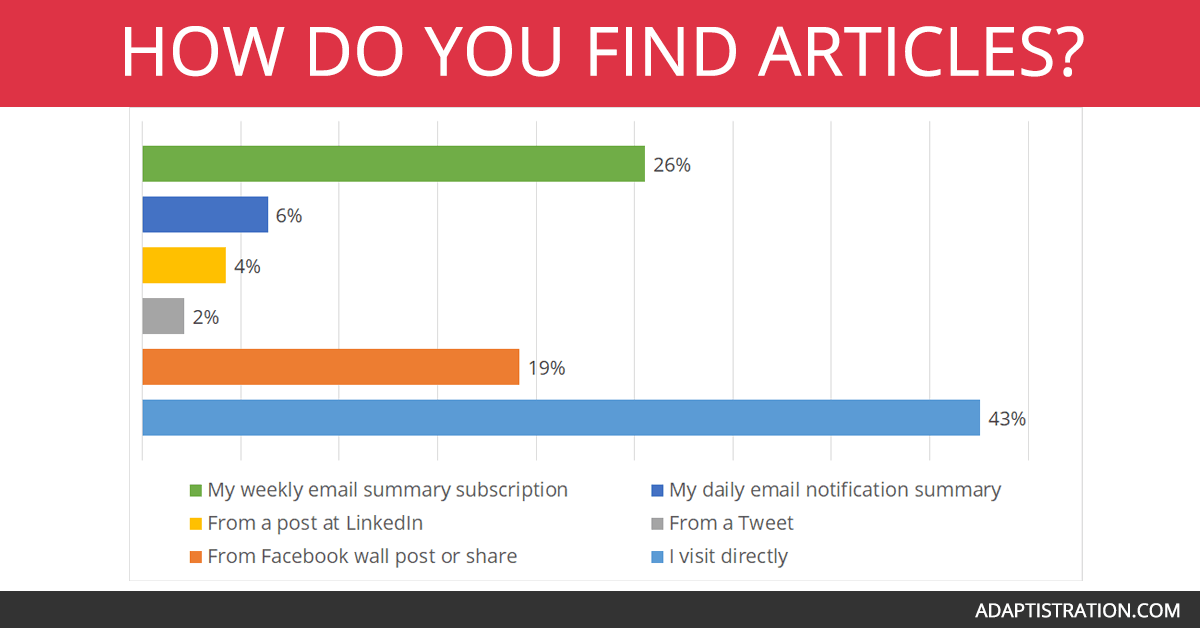
While nearly half of users find articles by visiting the blog directly, just over a quarter rely on their weekly email summary subscription. This beats origination traffic from social media sources combined. It just goes to show that the value of email communication is anything but irrelevant.
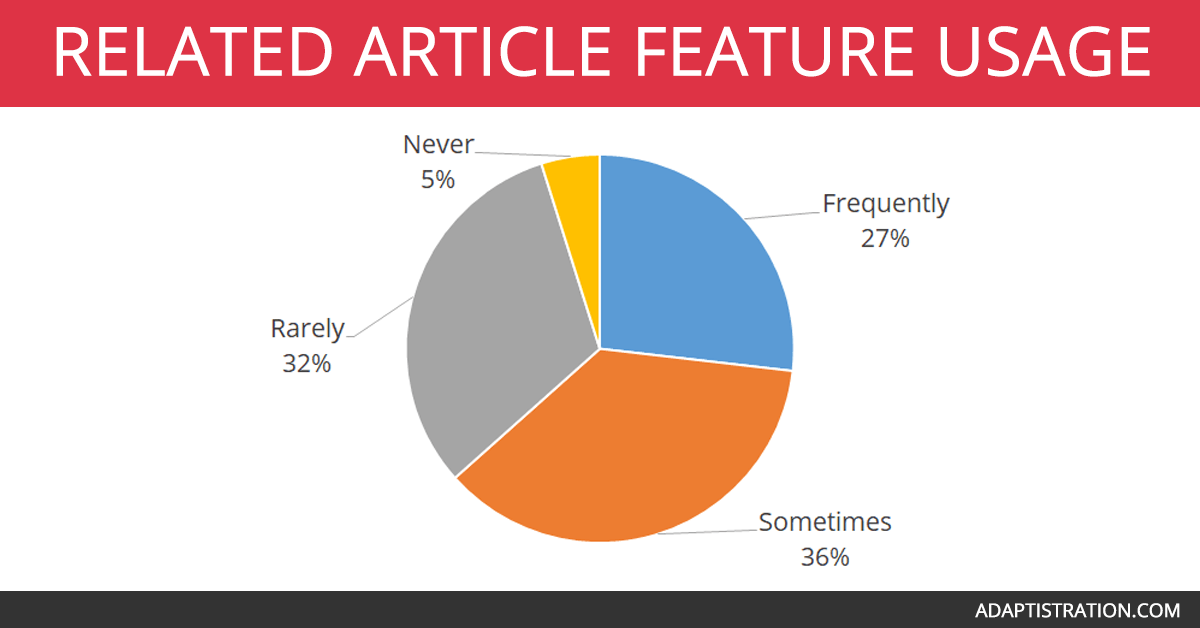
A new question for 2019 asked readers how often they use the Related Articles feature at the bottom of each individual post. This has been a difficult element to measure over the years and even though it’s something that can be tracked inside Google Analytics, that information doesn’t really indicate scope.
According to GA metrics, it seemed to get low enough usage that I was considering removing it entirely but after the survey results, that would have been a very unwise decision. A quarter indicate using it frequently while a third use it on a regular, but less frequent basis. This is an excellent example of data driven decision making in action.
Looking Around
The most popular culture blogs listed by 20 percent or more of respondents include (listed alphabetically):
- Alex Ross: The Rest is Noise
- Arts Hacker
- Butts In The Seats
- Know Your Own Bone
- Nonprofit AF
- Slipped Disc
Overall Satisfaction & Feedback
In the end, the blog only has value readers assign so I was very happy to see 60 percent very satisfied rate combined with 34 percent satisfied. Only seven percent indicated neutral satisfaction and none of the respondents were unsatisfied nor very unsatisfied.
Reader feedback included useful and gratifying responses. When asked which topics readers would like to see more of at Adaptistration, here’s what respondents had to say:
“Without hyperbole, everything I hear about or have questions about is answered through Adaptistration.”
“The topics covered by the blog, as the pointers to the other blogs, Butts in the Seats, etc. are very helpful.”
“Arts issues in higher ed, university school of music innovations, and podcasts.”
“More about labor relations and the business.”
“How-to advice for websites, social media, audience engagement, and development.”
“Artistic collaborations plus board and stakeholder engagement.”
“Diversity in cultural organizations.”
“Fundraising and musician participation.”
“Trends in programming and community engagement.”
“Data/survey-driven posts; entry/mid-level administrator challenges; Cross-industry collaborations; public policy issues; advocacy guides; civic organizations – run completely on volunteerism; and cultural placemaking.”
“More guest articles on days you aren’t otherwise posting.”
“Articles relating to concert programming.”
Warm & Fuzzies
We’ll wrap things up with excerpts from responses readers took the time to write out when asked what they liked best about the blog:
“Beyond ‘honest reporting’ I value Drew’s informative perspective. I appreciate that he doesn’t assume all readers understand the nuance of the many topics he covers. He takes time to explain the concepts and why they are important. I enjoy the many links he provides so readers can follow the source material while gaining more in-depth context from his editorial style. It has been my experience over the past 10 years that the best place to start looking for anything happening in our field is on Adaptistration. I believe Adaptistration to be the singular clearinghouse and rallying point for being informed about our field – not because it monopolizes the facts but because it facilitates informed understanding and gathers so many resources.”
“Varied content, relevant outside source links within articles (not just linking back to your own blog).”
“I like the stats included in articles.”
“Makes me feel like I’m up to date on things.”
“Writing style, industry understanding and insight, connections made throughout the arts world.”
“The frequency of posts and updates on major issues in the field.”
“I come to Adaptistration for your thorough analysis of news in the orchestral field.”
“The honest and transparent communication.”
“Industry data compiled for easy review.”
“The breadth of material covered. The ability to share comments and engage in dialogue. The ability to share the content through Twitter and Facebook.”
“Far and away, I like the insider info and perspectives on the orchestra field.”
“I like the current, behind the scenes reporting that is not covered anywhere else. Labor discussions during the Baltimore lock-out were very interesting and dove much further than face-value. I also found the orchestra governance essays very useful in my experience with my regional orchestra.”
“Detailed, often data-driven analysis or discussion of specific situations within the arts.”
“Hands-on advice, questioning what’s not working in the arts, highlighting people making change.”
“Diverse yet applicable content – few other blogs are curated to an extent that I can glean knowledge consistently even for a small budget organization.”
“I like getting more in-depth perspectives on cultural issues.”
“Good source for issues facing all arts organizations.”
“Updates on negotiations and updates on trends in arts management.”
“Fresh perspective and willingness to dig past prepared statements and public positions.”
“In depth coverage of specific events. Rather than moving on to the next, topics are revisited.”
“Challenging generally-accepted views in musician-audience interactions. I appreciate that this blog carefully examines underlying issues in reaching audiences as well as distilling news about orchestras that are struggling.”
“Honest delivery without bias toward musicians or administration.”
“It can be helpful as a way of keeping abreast of what’s happening in orchestras in the United States, even though I don’t work in that country anymore. And although I actually think it’s a weakness of the blog (in that I’d prefer more original writing and thinking), it can be quite handy that Adaptistration picks up on other people’s blogs, specifically Joe Patti and Holly Mulcahy, as it means I don’t have to follow those directly, which helps me keep my RSS feed trim.”
